Extension: Time Tracking and Graphing
Introduction
When building extensions, time and date stamps are often used to track study times, hours worked, and weekly data entered by the user. To illustrate working with these data types, this chapter describes the development of a time-tracking extension. This extension allows a user to enter time logs, which are then saved in the local database. With this data, JavaScript-based charts are then used to illustrate the user's data in the form of a bar and line chart. To tidy the user interface, jQuery UI is used to create an accordion layout on the extension, allowing the user to hide and show different sections when required.
This chapter begins in Section 7.2 Database Setup, describing the process of setting up a MongoDB database collection to store data entered by the user through the extension. To connect the MongoDB database to the extension, a custom Express.js API server is described in Section 7.3 API Server. To allow the user to log time and date data, Section 7.4 Extension describes the extension itself and the additional JavaScript required to graph the data collected. To conclude this chapter, Section 7.5 Summary shows the core takeaway tips.
Source code for this chapter can be found here.
Source code: /ch7/timetracking
Database Setup
Before getting started, ensure your MongoDB database is up and running on your machine, and you have MongoDB Compass installed to interact with the database. If not, head to Chapter 4, Section 4.5 The Database to review the database installation process. When your database is set up, launch MongoDB Compass and connect to the database server address localhost:27017. When connected to the MongoDB server, we need to create a new database. To do this, hover over the localhost address, and click the plus sign that appears, as shown in Figure 1.
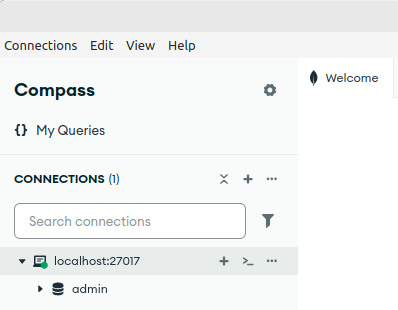
Figure 1: Clicking the plus sign on the left of MongoDB Atlas to create a new database.
After this, Figure 2 shows the dialog that opens when the plus sign is clicked. In this dialog, enter extension_time_manager as the database name, and times_logged as the collection name. To finish, click Create Database.
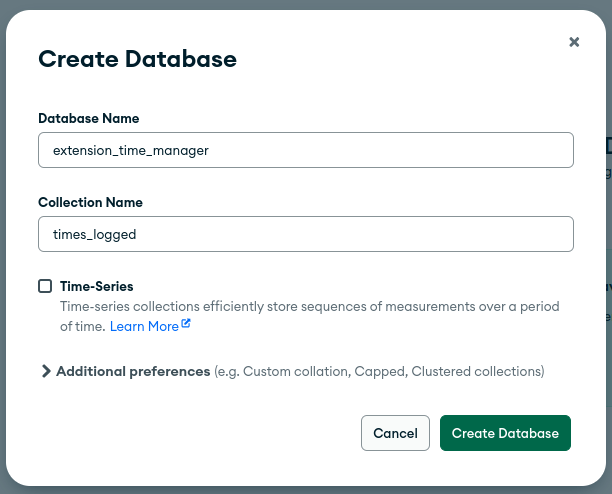
Figure 2: Adding the database name and collection name.
As this is a NoSQL database, we do not need to specify any record attributes or schema now. Later, when creating new records in the collection using the API server, four attributes will be added to each record. These attributes include: id, startTime, endTime, dateLogged, and workType. Section 7.3 API Server, next, describes the process of developing a custom API server to interact with this database.
API Server
In this section, we will outline the process of creating a custom API server to interact with the MongoDB database created in the previous section to store and retrieve individual time records logged by the user. To get started, we will use the API server previously described in Chapter 4, Section 4.4 Custom API Server. On this server, we will have four individual URLs that can be called by the extension. These include:
-
http://localhost:3000/api/ - The default URL for the API server.
-
http://localhost:3000/api/saveNewTimeRecord - URL which receives new log data from the extension when recorded by the user.
-
http://localhost:3000/api/getHoursByMonth - URL to return a JSON list of the hours worked in a given month.
-
http://localhost:3000/api/getHoursByDay - URL to return a JSON list of the hours worked on a specific day.
Source code: /ch7/timetracking/time-apiserver
To get started, inside the /routes/api.js file, we can remove the original code. We then need to add the basic boilerplate of this page. This includes importing express and the express router. The router.get() is then used to define a new function that is called when the / URL is called on the API. In this, the res.send() function returns a piece of text to the extension outlining that the call was successful.
var express = require("express");
var router = express.Router();

router.get("/", function (req, res, next) {
  res.send("The API was called!");
});
To allow the extension to save new time records to the database, a new URL titled /saveNewTimeRecord is added. When this is called, four parameters are sent across from the extension titled: startTime, endTime,dateLogged, and workType. To capture these, the req.query.xxx function is used where xxx is the name of the variable we wish to extract. Once extracted, each is placed into a local variable.
A connection is then opened to our local MongoDB database using the require syntax to first pull in the driver titled mongodb, and placed into a variable titled MongoClient. The URL of the database we are connecting to is then added. This contains localhost as the machine address and 27017 as the default port. This address is then placed into a variable titled uri. This string is then passed into the MongoClient and stored in a variable titled client.
A new asynchronous function is then created titled run() to contain the database call itself. In this, a try-catch is then added to try to connect to the database, and catch the error if something goes wrong. Just inside the try, the client.db() function is used to select the extension_time_manager database and place the reference into a variable titled database. The database.collection() function is then used to select the times_logged collection and place the reference into a variable titled collection.
router.get("/saveNewTimeRecord", function (req, res, next) {
  console.log("/saveNewTimeRecord");

  const startTime = req.query.startTime;
  const endTime = req.query.endTime;
  const dateLogged = req.query.dateLogged;
  const workType = req.query.workType;

  const { MongoClient } = require("mongodb");
  const uri = "mongodb://localhost:27017/";
  const client = new MongoClient(uri);

  async function run() {
    try {
      const database = client.db("extension_time_manager");
      const collection = database.collection("times_logged");
Once the database has been set up, we can move on to creating a new JSON record to put into it. First, the dateLogged parameter sent across from the extension is passed into a new Date() object titled event. The collection.insertOne() function is then called to insert a new JSON record in the database. The await syntax is added in front of this to pause the execution and wait for the record to be inserted before moving on to the next step. Inside this, each individual parameter name and variable value is passed into the query as key-value pairs. As we want to store the date in ISO format, the event object created earlier is used, and the toISOString() function is called to return the original date in ISO format.
After the insert has been performed, the res.json() function is then used to send back a JSON message to the URL caller (the extension) to indicate that the status is ok. A finally block is added into this process, which is always called, even if the insert process fails. The purpose of this is to always call the client.close() function to close the connection to the database. The last line after this block of code is the call to the run() function itself that was just created to begin the process of inserting the record into the database. In the case where this fails, the catch() function is called to catch the error.
     const event = new Date(dateLogged);

      const cursor = await collection.insertOne({
        startTime: startTime,
        endTime: endTime,
        dateLogged: event.toISOString(),
        workType: workType,
      });
      res.json({ status: "ok" });
    } finally {
      await client.close();
    }
  }
  run().catch(console.dir);
});
When data is added to the database, the user has the option to generate graphs based on this data. To do this, the /getHoursByMonth URL is added, which returns a JSON document containing all the hours logged in the database as a simple total for each month. This block of code starts with the router.get() function defining the /getHoursByMonth URL. Inside this definition, a console.log() is used to print to the server's console that the call has been successful. After this, a connection is created to the local database similar to the previous code.
An asynchronous function is then defined titled run() that is responsible for performing the database query. In this, the client.db() function is used to select the extension_time_manager database. Then the database.collection() function is used to select the times_logged collection and place the reference into a variable titled collection.
router.get("/getHoursByMonth", function (req, res, next) {
  console.log("/getHoursByMonth call success");

  const { MongoClient } = require("mongodb");
  const uri = "mongodb://root:example@localhost:27017/";
  const client = new MongoClient(uri);
  async function run() {
    try {
      const database = client.db("extension_time_manager");
      const collection = database.collection("times_logged");
As we want to return all the records in the database, the collection.find() function is called with no additional parameters, and we place the results into a variable titled cursor. Following this, we call the toArray() on the cursor reference to convert the data into an array.
Once the data has been collected from the database, we can begin the process of creating a custom array to hold all the data in a month-based structure. To do this, an array titled hoursEachMonth is created. This array contains an index between 0 and 11 for each month, where 0 is January, and 11 is December. With this, each position of the array is then set to 0 by default.
const cursor = collection.find();
const results = await cursor.toArray();

let hoursEachMonth = [];

hoursEachMonth[0] = 0;
hoursEachMonth[1] = 0;
hoursEachMonth[2] = 0;
hoursEachMonth[3] = 0;
hoursEachMonth[4] = 0;
hoursEachMonth[5] = 0;
hoursEachMonth[6] = 0;
hoursEachMonth[7] = 0;
hoursEachMonth[8] = 0;
hoursEachMonth[9] = 0;
hoursEachMonth[10] = 0;
hoursEachMonth[11] = 0;
To process the data retrieved from the database, a for loop is then used to loop over each of the result records in the results object, from record 0 up to results.length(). Each individual record represents one log entry by the user. The attributes for the record are then extracted from the record, including the startTime, endTime, and dateLogged. To calculate the total hours, the endTime is subtracted from the startTime, and placed into a local variable titled totalHours.
Once the dateLogged has been extracted, it is processed further. The dateLogged variable contains a day, month, and year separated by dashes e.g., 11-12-25, the .split("-").map(Number) command is used to split these three pieces apart and place them into local variables titled day, month, and year.
For each record processed, the month's total hours are updated. To do this, the hoursEachMonth[month-1] syntax is used to select the location where the total for a given month is kept in the array.
An example of this is when the month of the record being processed is 12, -1 is appended to get the correct array position, e.g., 11. The new totalHours is then appended to the selected month’s total in the array. At the end of this process, to ensure the results are totaling correctly, a for loop is used to print each month's total to the server's console.
for (let i = 0; i < results.length; i++) {
  let startTime = results[i].startTime;
  let endTime = results[i].endTime;
  let dateLogged = results[i].dateLogged;

  let totalHours = endTime - startTime;

  // break apart date logged
  const [day, month, year] = dateLogged.split("-").map(Number);

  // drop totals in
  hoursEachMonth[month - 1] = hoursEachMonth[month - 1] + totalHours;
}

// print to the console to review hours
for (let i = 0; i < 12; i++) {
  console.log("Month " + i + " total" + hoursEachMonth[i]);
}
Once stored inside the hoursEachMonth array, where each position is the total hours for that month, the process of sending JSON back to the extension is performed. To do this, the res.json() function is used, which sends the raw JSON back. Inside this function, a piece of JSON containing two core attributes, months and hours, is created.
For the months attribute, text is added to define each month from 1 to 12. The values associated with these are stored in the hours attribute, which in this case is the hoursEachMonth array, that contains 12 totals, once for each month. Similar to the previous example, the try-catch block is finished by adding a finally attribute that will run even if the process was successful or not. In this case, we call client.close() to ensure the database connection is closed.
 res.json({
        months: ["Month 1", "Month 2", "Month 3", "Month 4", "Month 5", "Month 6", "Month 7", "Month 8", "Month 9", "Month 10", "Month 11", "Month 12"],
        hours: hoursEachMonth,
      });
    } finally {
      await client.close();
    }
  }
  run().catch(console.dir);
});
When the http://localhost:3000/api/getHoursByMonth endpoint is called from the extension to get data, the following JSON output will be returned. In this output, we can see that for each month, there is an associated total number of hours. These totals are dependent on the number of times logged in your database collection by the extension.
{
    "months": [
        "Month 1",
        "Month 2",
        "Month 3",
        "Month 4",
        "Month 5",
        "Month 6",
        "Month 7",
        "Month 8",
        "Month 9",
        "Month 10",
        "Month 11",
        "Month 12"
    ],
    "hours": [
        7,
        0,
        0,
        0,
        0,
        0,
        0,
        0,
        36,
        0,
        58,
        0
    ]
}
Similar to the previous URL, the /getHoursByDay URL is used to return the total hours each day between a given start date and end date selected by the user. At the start block of code, the router.get() is used to define a new URL titled getHoursByDay. Inside this function, a simple console.log() is performed to print to the console that the URL call has been successful. After this, the two attributes that are required for this function are first extracted from the query. These include the start and end dates that the user wishes to select the records for. These are extracted using the req.query syntax and placed into two local variables. A MongoDB connection is then defined, similar to the two previous examples.
To hold the database query itself, a new asynchronous function titled run() is created. A new try-catch block is then added to connect to the database and catch the error if anything goes wrong. Inside this try statement, the client.db() function is used to select the extension_time_manager database, and the database.collection() function is used to select the times_logged collection.
router.get("/getHoursByDay", function (req, res, next) {
  console.log("/getHoursByDay call success");


  let start = req.query.start;
  let end = req.query.end

  const { MongoClient } = require("mongodb");
  const uri = "mongodb://root:[email protected]:27017/";
  const client = new MongoClient(uri);

  async function run() {
    try {
      const database = client.db("extension_time_manager");
      const collection = database.collection("times_logged");
After this, the find() function is used to search for time records between the start and end dates selected by the user. To do this, we search the dateLogged attribute. The $gt: new Date(start).toISOString() syntax is added to define that we want all records greater than the start date. This is passed as a new Date() object. The toISOString() function is appended to convert the date into the predefined ISO format, which we used when storing records in the database. To define the end date that we are interested in finding records up to, the $lt: new Date(end).toISOString() syntax is used. This works similarly to the previous selector, but uses less than instead of the greater than operator. When this find() function returns records, the reference is placed into an object titled cursor. The cursor.toArray() function is then used to convert it into an array.
Two new arrays are then created to hold the processed data, one titled hours and another titled dates. Once the data has been selected, we can begin the process of looping over the individual records returned from the database to calculate the totals. To do this, we use a for loop which loops from record 0 to record results.length(), which contains the max record number. For each individual record, the startTime is extracted, followed by the endTime, and the dateLogged. Each of these is then placed into local variables for easy access.
As the dateLogged variable is in ISO format, such as 2024-11-01T00:00:00.000Z, we need to break it apart and extract the time. The dateLogged.split('T')[0]; syntax is used to take the date, split the date apart where the letter T is present in the date. This returns an array of two elements where the element at position 0 of the array is the date string itself, such as 2024-11-01, and element 1 is the time stamp extracted.
To calculate the total hours for a given day record, the startTime is extracted from the endTime and placed into a local variable titled total. The two elements we require for the visualization are the total hours followed by the date. The hours.push(total); syntax is used to push the total number of hours variable onto the hours array. The dates.push(cleanDate); syntax is then used to push the cleaned version of the data onto the dates array.
const cursor = collection
  .find({
    dateLogged: {
      $gt: new Date(start).toISOString(),
      $lt: new Date(end).toISOString(),
    },
  })
  .sort({ dateLogged: 1 });
const results = await cursor.toArray();

let hours = [];
let dates = [];

for (let i = 0; i < results.length; i++) {
  let startTime = results[i].startTime;
  let endTime = results[i].endTime;
  let dateLogged = results[i].dateLogged;
  const cleanDate = dateLogged.split("T")[0];
  let total = endTime - startTime;
  hours.push(total);
  dates.push(cleanDate);
}
Once the final hours and dates array are filled, we can begin the process of sending the result back to the extension. To do this, the res.json() function is used, and the hours and dates arrays are passed in, where hours is the name of the array, and the hours array is passed for the value. This is repeated for the dates array. Similar to the previous examples, the finally block is added, followed by a call to the run() function that was just defined to trigger the entire process to begin.
      res.json({ hours: hours, dates: dates });
    } finally {
      await client.close();
    }
  }
  run().catch(console.dir);
});
On the user interface of the extension, the user has the ability to select a start and end date. Between these two points, all records are returned from the database. When the user clicks Visualise, a call is made to the /getHoursByDay URL shown below, and the start and end date are passed in as two separate variables. The values for these variables are based on whichever dates the user has selected on the user interface.
http://localhost:3000/api/getHoursByDay?start=2020-1-1&end=2025-1-1
Below shows an example of a response that is returned in JSON format when the URL is called when records exist in the database. The hours array contains the total hours for each day. The dates array contains each individual date extracted from the records selected. Each hour total in the hours array corresponds to a single date in the dates array.
{
    "hours": [
        18,
        18,
        15,
        8,
        16,
        16,
        3
    ],
    "dates": [
        "2024-09-01",
        "2024-09-02",
        "2024-11-01",
        "2024-11-02",
        "2024-11-17",
        "2024-11-17",
        "2024-11-20"
    ]
}
Once all the code has been added to the /routes/api.js, save all the changes, and we can then navigate to the root of the project using a command prompt. Here we can run the following command to turn the server on:
DEBUG=myapp:* npm start
Now that the API server is ready, we can move on to building the extension itself, which allows the user to log time entries and visualize the data. It is important to remember that the database and API server must remain running to allow the extension to function correctly. Section 7.4 Extension, next. describes the development of the extension.
Extension
In this section, the process of developing the time logging and visualization extension is described. This extension allows the user to log individual time entries and then, when required, visualize this data using a JavaScript chart. To get started, create a new folder titled time-extension and create the following empty files inside it:
File Structure
-
/manifest.json
-
/interface.html
-
/showChart.html
-
/popup.js
-
/chart_draw.js
-
/icon.png
-
/lib/
Source code: /ch7/timetracking/time-extension
The manifest.json file is the core of the extension, which describes the name, description, version number, and permissions of the extension. The interface.html contains the HTML components to record time entries in the database. The showChart.html is a page that, when passed selected days or weeks, graphs the selected data on a JavaScript Charts.js bar chart. The popup.js file is the main JavaScript file for the extension, which contains the button click listeners and functions to interact with the back-end API server. The icon for the extension is a simple smiley face titled icon.png
For this project, four additional libraries are required. These include Bootstrap, jQuery, jQueryUI, and Chart.js. Each of these is stored inside the extension's lib folder. Both Bootstrap and jQuery UI have an additional CSS file that is added for styling.
File Structure
-
/lib/bootstrap_bundle.min.js
-
/lib/bootstrap.min.css
-
/lib/chart.js
-
/lib/jquery.js
-
/lib/jquery-ui.js
-
/lib/jquery-ui.css
-
/lib/images/ui-icons_444444_256x240.png
The bootstrap_bundle.min.js file is the basic Bootstrap library that is used for adding an accordion-based view to the user interface, allowing the user to switch between sections on the user interface. This file also has an associated CSS file titled bootstrap.min.css. For graphing data on charts after the data has been collected, the Chart.js library is included as chart.js. To allow elements on the user interface to be selected, jQuery is included as jquery.js. jQuery is also a dependency of the jQueryUI library, which is used for adding a visual calendar date picker. This is added as jquery-ui.js for the JavaScript and jquery-ui.css for the associated style sheet. As the calendar requires forward and back buttons icons to move between months, a PNG file is also included in this folder. To access these libraries, Chapter 1, Section 1.4 Additional Libraries describes the process.
File Name: manifest.json
In the manifest.json file, we define the basic attributes of the extension, including the name, description, and version number for our extension. The action attribute is then defined. In this example, the default_popup is set to open the file titled interface.html to show the user the main user interface when the user clicks the extension icon. The default_icon is set to the icon.png file that contains a simple smiley face. The permissions needed for this extension are the tabs permission to have the ability to open tabs and the webRequest, to make requests over HTTP. Two URL wildcards are then added for the host_permission attribute to allow the extension to access any external URLs.
{
    "manifest_version": 3,
    "name": "Time tracking extension",
    "description": "My custom time tracking extension",
    "version": "1.0",
    "action": {
        "default_popup": "interface.html",
        "default_icon": "icon.png"
    },
    "permissions": [
        "tabs",
        "webRequest"
    ],
    "host_permissions": [
        "http://*/*",
        "https://*/*"
    ]
}
File Name: interface.html
The interface.html file is the core user interface that is shown to the user when the icon for the extension is clicked in the menu bar. This interface uses a Bootstrap accordion to hide and show different sections of the extension, depending on which the user selects. At the very top of this file, a <html> tag is added, followed by a <body> tag with the default width set to 500px.
Two CSS files are pulled in from the lib folder of the extension. The first is the default Bootstrap theme for general user interface component styling and creating a content accordion, and the jQuery UI theme that is used for the pop-up calendar. To create the accordion, a <div> tag is first added, with the class set to accordion. This tells Bootstrap to apply the default accordion style.
Inside this, another <div> is added with the class set to accordian-item. Inside this, a <h2> tag is used with the class set to accordian-header to apply the Bootstrap style. As the accordions show and hide based on button clicks, a button is then added with the class set to accordian-button, and the type set to button. This button contains the text Log new time record and will be visible to the user.
<html>
<body style="width:500px">
    <link rel="stylesheet" href="lib/bootstrap.min.css">
    <link rel="stylesheet" href="lib/jquery-ui.css">
    <div class="accordion" id="accordionExample">
        <div class="accordion-item">
            <h2 class="accordion-header">
                <button class="accordion-button" type="button" data-bs-toggle="collapse" data-bs-target="#collapseOne"
                    aria-expanded="true" aria-controls="collapseOne">
                    Log new time record
                </button>
            </h2>
Below this heading, the body of the first accordion is contained in a <div> tag with the ID set to collapseOne. The class is set to accordion-collapse collapse show. The data-bs-parent attribute is then added to link this <div> to the parent <div> titled accordionExample. Another <div>is then added with the class set to accordion-body. This is the body of the accordion, which contains the area where the user can log individual time records.
The information gathered during this step includes the start time, end time, date, and work type performed. For the start time, a <select> is added with the ID startTime. To aid the movement of data between the extension user interface and the API server, the value associated with each time is a number between 1 and 23. The same process is then repeated for the endTime attribute.
<div id="collapseOne" class="accordion-collapse collapse show" data-bs-parent="#accordionExample">
    <div class="accordion-body">

    <b>Start time:</b>
    <select id="startTime" class="form-select" aria-label="">
        <option value="">Select time</option>
        <option value="1">1 a.m.</option>
        <option value="2">2 a.m.</option>
        <option value="3">3 a.m.</option>
        <option value="4">4 a.m.</option>
        <option value="5">5 a.m.</option>
        <option value="6">6 a.m.</option>
        <option value="7">7 a.m.</option>
        <option value="8">8 a.m.</option>
        <option value="9">9 a.m.</option>
        <option value="10">10 a.m.</option>
        <option value="11">11 a.m.</option>
        <option value="12">12 p.m.</option>
        <option value="13">1 p.m.</option>
        <option value="14">2 p.m.</option>
        <option value="15">3 p.m.</option>
        <option value="16">4 p.m.</option>
        <option value="17">5 p.m.</option>
        <option value="18">6 p.m.</option>
        <option value="19">7 p.m.</option>
        <option value="20">8 p.m.</option>
        <option value="21">9 p.m.</option>
        <option value="22">10 p.m.</option>
        <option value="23">11 p.m.</option>
    </select>

    <b>End time:</b>
    <select id="endTime" class="form-select" aria-label="">
        <option value="">Select time</option>
        <option value="1">1 a.m.</option>
        <option value="2">2 a.m.</option>
        <option value="3">3 a.m.</option>
        <option value="4">4 a.m.</option>
        <option value="5">5 a.m.</option>
        <option value="6">6 a.m.</option>
        <option value="7">7 a.m.</option>
        <option value="8">8 a.m.</option>
        <option value="9">9 a.m.</option>
        <option value="10">10 a.m.</option>
        <option value="11">11 a.m.</option>
        <option value="12">12 p.m.</option>

        <option value="13">1 p.m.</option>
        <option value="14">2 p.m.</option>
        <option value="15">3 p.m.</option>
        <option value="16">4 p.m.</option>
        <option value="17">5 p.m.</option>
        <option value="18">6 p.m.</option>
        <option value="19">7 p.m.</option>
        <option value="20">8 p.m.</option>
        <option value="21">9 p.m.</option>
        <option value="22">10 p.m.</option>
        <option value="23">11 p.m.</option>
    </select>
For the date attribute, a simple <input> field is added with the ID dateLogged. This is a placeholder, as when the <input> field is clicked, later, jQuery UI will be used to turn this field into a pop-up calendar where the user can select the desired date. Similar to the time, a <select> element is used for the work type attribute. At the very end of this, a <button> element is added with the ID set to saveRecord. Later, JavaScript will be added to listen for this button click to trigger the data saving process.
<b>Date (dd-mm-yyyy):</b>
<input type="text" class="form-control" id="dateLogged" placeholder="">
<b>Work type</b>
<select id="workType" class="form-select" aria-label="">
    <option value="">Select type</option>
    <option value="normal">Normal hours</option>
    <option value="overtime">Overtime</option>
</select>
<div id="space" style="height:20px"></div>
<button id="saveRecord" type="button" class="btn btn-primary">Save record</button>
</div>
</div>
</div>
Similar to the previous accordion element, a second element is added. To add this, a <div> tag is added with the class set to accordion-item. This is followed by a simple <h2> tag with the class set to accordion-header. Inside this, a <button> tag with the data-bs-target set to collapseTwo is used to present the text View chart that, when clicked, will expand the section and close the previous accordion element.
A <div> tag is then added with the ID set to collapseTwo. The data-bs-parent is set to accordionExample to reference the parent <div> tag. Inside this, a <div> is created with the class set to accordion-body to define the body of the accordion element. In here, a <input> field is used to define the chart start date. This field has the ID set to chartStart, which will be used later when JavaScript is used to select the element. The same process is repeated for the end date, which has an <input> field with the ID set to chartEnd.
Once the dates are selected, the user has the option to choose between two graph types: by date or by month. A <button> tag is then added with the ID genChartDayRange with the class set to btn btn-primary to use the default Bootstrap style. This button contains the text Total hours by day range. A second button is then added with the ID set to genChartMonth, with the text Total hours by Month.
<div class="accordion-item">
    <h2 class="accordion-header">
        <button class="accordion-button collapsed" type="button" data-bs-toggle="collapse" data-bs-target="#collapseTwo"
            aria-expanded="false" aria-controls="collapseTwo">
            View chart
        </button>
    </h2>

    <div id="collapseTwo" class="accordion-collapse collapse" data-bs-parent="#accordionExample">
        <div class="accordion-body">
            Chart start date:
            <input type="text" class="form-control" id="chartStart" placeholder="">
            Chart end date:
            <input type="text" class="form-control" id="chartEnd" placeholder="">
            <div style="height:20px"></div>
            <button type="button" id="genChartDayRange" class="btn btn-primary">Total hours by day range</button>
            <div style="height:20px"></div>
            <button type="button" id="genChartMonth" class="btn btn-primary">Total hours by Month</button>
        </div>
    </div>
</div>
</div>
At the very end of the HTML file, <script> tags are used to pull in the jQuery, a dependency of jQueryUI, and jQuery UI, which is used for turning the <input> fields into date pickers. Bootstrap is also included here to add the style and functionality of the accordion. After this, the JavaScript file titled popup.js is included. This file contains all the JavaScript for the interface.html page, as no JavaScript can be added to the HTML file itself when developing Chrome extensions.
<script src="lib/jquery.js"></script>
<script src="lib/jquery-ui.js"></script>
<script src="lib/bootstrap.bundle.min.js"></script>
<script src="popup.js"></script>
</body>

</html>
View Results
Once all the files have been saved, load the extension into your browser as previously described in Chapter 2, Section 2.3 Loading your Extension. When the extension icon is clicked, Figure 3 shows the complete interface that opens. This pop-up contains the accordion structure that allows different sections to be expanded or hidden. On this interface, the user can log a new time entry by adding the start time, end time, date, and type of work performed. Once the data has been entered, the user clicks Save record to send the data to the database.
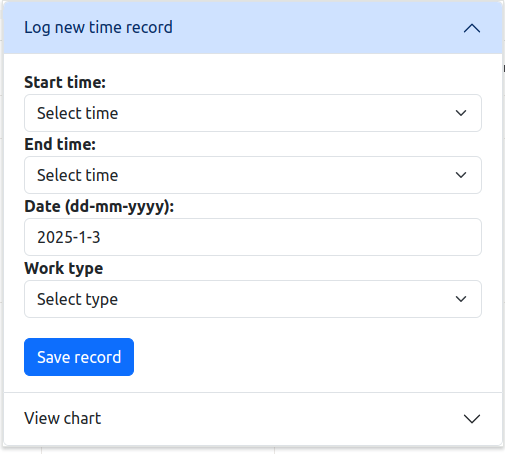
Figure 3: Log new time record accordion expanded on the user interface.
When either of the date input fields is clicked, the jQueryUI calendar becomes available as shown in Figure 4.
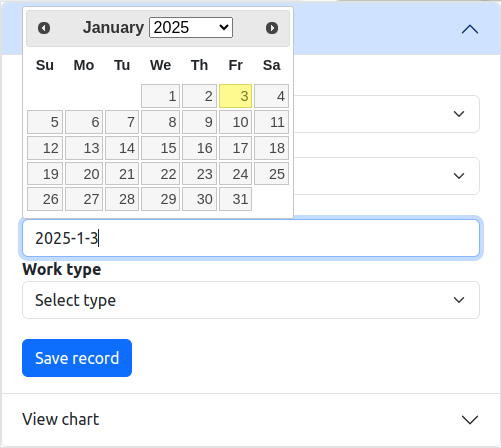
Figure 4: jQuery pop-up date selection calendar when the date input field is clicked.
Figure 5 shows the interface when the second accordion item is clicked and expanded. Here, the user can generate a graph by entering the date range of interest and clicking the first button, or clicking the second button to generate a graph of all records ordered by month.
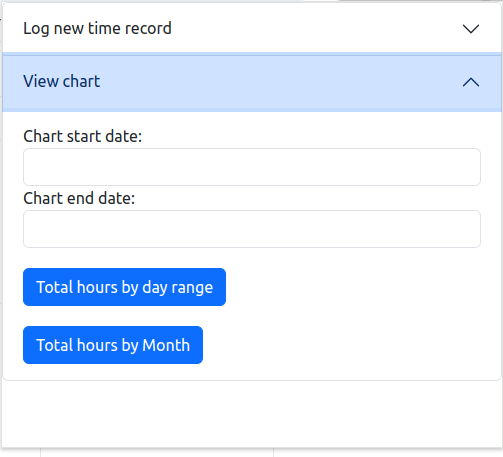
Figure 5: Viewing the accordion section showing graph types.
Now that the extension user interface is complete, we can move on to the process of creating the JavaScript graphs that the extension generates.
File Name: popup.js
The core JavaScript for the extension user interface is contained inside the popup.js file. When any of the buttons are clicked on the user interface, this file contains the listeners that trigger each process to start. At the start of this file, the getElementById() selector is used to select the button with the ID set to saveRecord. Using this reference, the addEventListener() function is used to append a click listener which calls the saveNewRecord() function when the button is clicked.
The body of this function is then defined. Inside this function, a message is first printed to the console to indicate that the click has been performed correctly. After this, the document.getElementById() selector is used to select the <input> fields from the user interface for the startTime, endTime, dateLogged, and workType. Once the elements have been selected, the .value is called to extract the value from the fields. Each value is placed into local variables for easy access.
A call is then made to the saveNewTimeRecord_db() function, and each of the individual attributes gathered is passed to it. This function is responsible for performing the asynchronous call to the API server. An alert() statement is then used to pop up the word Saved! to the user.
// save record button
let saveButton = document.getElementById("saveRecord");
saveButton.addEventListener("click", saveNewRecord);

function saveNewRecord() {
  console.log("Saving new record...");

  let startTime = document.getElementById("startTime").value;
  console.log("Start time: " + startTime);
  let endTime = document.getElementById("endTime").value;
  console.log("End time: " + endTime);
  let dateLogged = document.getElementById("dateLogged").value;
  console.log("dateLogged: " + dateLogged);
  let workType = document.getElementById("workType").value;
  console.log("workType: " + workType);

  saveNewTimeRecord_db(startTime, endTime, dateLogged, workType);
  alert("Saved!");
}
The saveNewTimeRecord_db() function is then added, which is responsible for communicating with the API server. When this function is called, the startTime, endTime, dateLogged and workType variables become available, which were gathered from the user interface.
A variable titled url is added with the URL for the API server page. This contains a reference to the location where the server is running, http://localhost:3000, and the endpoint URL /api/saveNewTimeRecord. Each of the individual parameters is then passed to the URL as key-value pairs separated by ampersands, such as startTime as the parameter name, and the ${startTime} syntax to drop the startTime value into the string. A try-catch block is then set up to try and call the server and catch the error if it fails.
Inside this try, a fetch() is then performed on the URL to call the API server. When the call is finished, the result is placed into a variable titled response. A call is then made to the response.json() function to extract the JSON returned and place it into a local variable titled json, which is then returned to the caller of the function. The catch statement is then added to catch the error if the fetch() fails.
// asyns function to call the API server.
async function saveNewTimeRecord_db(startTime, endTime, dateLogged, workType) {
  const url = `http://localhost:3000/api/saveNewTimeRecord?startTime=${startTime}&endTime=${endTime}&dateLogged=${dateLogged}&workType=${workType}`;
  try {
    const response = await fetch(url);
    const json = await response.json();
    return json;
  } catch (error) {
    console.error(error.message);
  }
}
Once the user has logged time records, they then have the option to generate the charts. This first begins by using the getElementById() function to select the genChartByDayRange button. Once selected, the addEventListener() function is used to append a click listener that, when triggered, calls the byDay() function.
The byDay() function is then defined. Inside this function, the jQuery selector is used to select the <input> field with the ID set to chartStart. The val() function is used to extract the value and place it into a variable titled start. This is repeated for the chartEnd <input> field to extract the end date selected by the user and place it into a local variable titled end.
Once these two values have been extracted, we can trigger the chart HTML page to open. Instead of opening the chart inside the extension, the chrome.tabs.create() function is called to create a new tab in the user's web browser. The URL attribute is set to show the showChart.html page that contains the chart itself. Three attributes are then passed to this page as key-value pairs with & symbols between them: the type of chart, the start date, and the end date.
let genChartDayRange = document.getElementById("genChartDayRange");
genChartDayRange.addEventListener("click", byDay);

function byDay() {
  let start = $("#chartStart").val();
  let end = $("#chartEnd").val();
  chrome.tabs.create({
    url: "showChart.html?type=day&start=" + start + "&end=" + end,
  });
}
The second chart option is the process of generating a chart by month. To do this, the getElementbyId() selector is used to select the <button> with the ID set to genChartMonth. With this reference, a click handler is appended to the button using the addEventListener() function. When a click occurs, a call is made to the byMonth() function. In this function, a call is made to the chrome.tabs.create() function again to show the same showChart.html page in a new tab. Instead of a range, this page is passed a single attribute titled type which is set to month.
let genChart = document.getElementById("genChartMonth");
genChart.addEventListener("click", byMonth);

function byMonth() {
  chrome.tabs.create({
    url: "showChart.html?type=month",
  });
}
As dates are used a lot in this extension, a function titled getCurrentDate() is added. This contains a call to the Date() JavaScript function to return the current date. Using this date object, calls to the built-in functions getDate(), getMonth() and getFullYear() are performed to extract the day, month, and year from the date and place them into local variables.
Once this function gathers the date components, a new variable titled currentDate is created. This contains a string which uses the ${year} syntax to drop the year, month, and day variables into a new string with dashes between the values. At the end of this process, the currentDate is returned to where the function was called.
function getCurrentDate() {
  const date = new Date();
  let day = date.getDate();
  let month = date.getMonth() + 1;
  let year = date.getFullYear();
  let currentDate = `${year}-${month}-${day}`;

  return currentDate;
}
The final piece of JavaScript added to this file is the jQuery syntax for the on load function shown as $(function () . This is used when the user interface is completely loaded in the browser; the code inside this block will then run. The jQuery selector is used to select the dateLogged attribute on the user interface and set the default start date on the calendar to be the current date by making a call to the getCurrentDate() function that returns the formatted date string.
The jQuery selector is used to select the <input> fields with the IDs set to dateLogged, chartStart, and chartEnd. The jQuery datepicker() function is then called on these <input> fields to convert them into pop-up calendars when the fields are clicked. Inside these datePicker() functions, the default date format yy-mm-dd is then defined for each of the calendars. A final attribute titled changeYear is added, which is set to true to allow the user to move forward and backward using the year selector.
$(function () {
  $("#dateLogged").val(getCurrentDate());
  $("#dateLogged").datepicker({ dateFormat: "yy-mm-dd", changeYear: true });
  $("#chartStart").datepicker({ dateFormat: "yy-mm-dd", changeYear: true });
  $("#chartEnd").datepicker({ dateFormat: "yy-mm-dd", changeYear: true });
});
File Name: showChart.html
When the user attempts to view a chart, a new tab is opened, and the URL is set to showChart.html. The purpose of this file is to define a <div> tag where the JavaScript chart will be shown. In this tag, the style attribute is added, and the default height and width for the chart are defined. Inside this, a <canvas> tag is added with the ID set to myChart. This is the location where the chart will appear. Two JavaScript files are then imported using the <script> syntax. The first is the chart.js file stored in the lib folder. The second is the chart_draw.js file that contains all the custom JavaScript to create the chart on the <canvas> just defined tag.
<div style="height:500px; width:500px">
    <canvas id="myChart"></canvas>
</div>

<script src="lib/chart.js"> </script>
<script src="chart_draw.js"> </script>
File Name: chart_draw.js
As no JavaScript can be added to the showChart.htmll page itself, all the JavaScript is stored inside a separate file titled chart_draw.js. This file is responsible for gathering the required data from the API server and plotting it to a custom chart. The first element in this file is a simple console.log() to print to the console that the file has loaded. After this, the getElementById() selector is used to select the HTML tag with the ID set to myChart and place the reference into a variable titled ctx.
As this one file is used to show two different graphs based on the selection of the user, a local variable titled queryString is created with the value to set window.location.search. This is the raw URL of the page along with any parameters that have been passed to it. In our example, the extension will send across the chart type the user selected, which can be extracted from this URL.
After this, the queryString is passed into an object titled URLSearchParams(). This places each of the individual key-value pairs from the URL in an easy-to-access format. A call can then be made to the object urlParam.get() to retrieve the individual values by passing in the key name of the value we want. In this example, we are passing in the type key, which will return the type of chart to generate and place the string into a variable titled chartType. To aid debugging, the chart type is printed to the console here also.
console.log("Running chart_draw.js");
const ctx = document.getElementById("myChart");
const queryString = window.location.search;
const urlParams = new URLSearchParams(queryString);
const chartType = urlParams.get("type");
console.log("chart type to make: " + chartType);
An if statement is then added to check which type of chart to create. In the case where the chartType variable is set to day, the first block of code will run. In this, a new function titled runGetHoursByDay() is first added. In this function, the start and end variables are extracted from the urlParams object previously defined and placed into local variables. The URL for the API server is then defined as a string in a variable titled url. The API page being called is the /getHoursByDay page that takes in the start variable and the end variable to retrieve the records from the database.
This URL on the API server that was defined in the previous section retrieves a JSON document containing all the relevant data. To perform the call, a try-catch block is first added. In the try, a fetch() is performed and the URL is passed in. When complete, the result goes into a variable titled response. A call is then made to the response.json() function to extract the JSON and place it into a variable titled json. A catch statement is then added to catch any errors if the request fails.
if (chartType == "day") {
  // ------------------------------------
  //  chart get hours by day
  // --------------------------------------
  async function runGetHoursByDay() {
    const start = urlParams.get("start");
    const end = urlParams.get("end");
    const url =
      "http://localhost:3000/api/getHoursByDay?start=" + start + "&end=" + end;
    try {
      const response = await fetch(url);
      const json = await response.json();
      return json;
    } catch (error) {
      console.error(error.message);
    }
  }
To trigger this function, a call is made to the runGetHoursByDay() function. When the data fetch process is finished, the then() block of code will trigger. This contains a single attribute titled content. This content contains all relevant JSON records that were rendered by the API server. After the data has been gathered, the process of creating the chart can be performed. A new Chart() object is then created, and the reference ctx gathered earlier is passed in.
The type of chart is set to line. The data attribute for the chart contains two core elements, the labels for the graph and the raw data stored in the datasets attribute. The labels attribute is set to the content.dates. This is the dates attribute of the JSON returned from the API server.
Inside the datasets attribute, the label is set to show Hours worked. The data attribute is then added with the value set to content.hours, which is the hours attribute of the JSON content received. The borderWidth is then defined as 2. A final options attribute is then added, which contains a y attribute that defines that beginAtZero is set to true. This allows elements on the graph to start at 0.
runGetHoursByDay().then((content) => {
  console.log(content.hours);

  new Chart(ctx, {
    type: "line",
    data: {
      labels: content.dates, // dates
      datasets: [
        {
          label: "Hours worked",
          data: content.hours, // hours worked
          borderWidth: 2,
        },
      ],
    },
    options: {
      scales: {
        y: {
          beginAtZero: true,
        },
      },
    },
  });
});
In the case where the chartType attribute at the top of the page was set to month, the else if block of code will run. This code is very similar to the previous section with minor changes. The first of these changes is a call to the /getHoursByMonth URL to retrieve all records in the database. The second core difference is inside the new Chart(). Here, the type attribute is set to a bar instead of a line based graph in the previous example. The same code as the previous section is then used to pass the labels and the raw data into the graph.
} else if (chartType == "month") {
  // ------------------------------------
  //  chart get hours by day
  // --------------------------------------
  async function runGetHoursByDay() {
    const url = "http://localhost:3000/api/getHoursByMonth";
    try {
      const response = await fetch(url);
      const json = await response.json();
      return json;
    } catch (error) {
      console.error(error.message);
    }
  }

  runGetHoursByDay().then((content) => {
    console.log(content.hours);

    new Chart(ctx, {
      type: "bar",
      data: {
        labels: content.months, // dates
        datasets: [
          {
            label: "Hours worked",
            data: content.hours, // hours worked
            borderWidth: 2,
          },
        ],
      },
      options: {
        scales: {
          y: {
            beginAtZero: true,
          },
        },
      },
    });
  });
}
Once all of these files have been created and updated. We can then load the extension into a Chrome browser as previously shown in Chapter 2, Section 2.3 Loading your Extension. After the extension has been loaded, ensure the API server and the MongoDB database are running before testing the extension.
View Results
After the extension has been loaded, Figure 6 shows the complete interface for the first accordion when expanded. Here, we can then log new time records in the database from the extension.
Figure 6: Log new time record accordion expanded on the user interface.
When the user clicks the Save record button, a new JSON record is inserted into the MongoDB database. Below, a complete example of a single JSON record can be seen. In this, we can see the start time was 3, indicating 3 a.m., and the end time was 18, indicating 6 p.m. The ISO date format can also be seen for the dateLogged.
{
    "_id": {
        "$oid": "673cba83256c4a83ab8035f1"
    },
    "startTime": "3",
    "endTime": "18",
    "dateLogged": "2025-11-01T00:00:00.000Z",
    "workType": "Overtime"
}
When a few records have been added, we can view a graph based on this data. It is important to remember that the graphs that are generated will be based on the time log records in your database. If no records exist, the charts will be blank. From the extension, click the View Chart accordion element, as shown in Figure 7.
Figure 7: Extension view chart accordion element.
From here, we can enter a date range and click the Total hours by day range button. When this button is clicked, the showChart.html page is opened in a new tab, and a graph similar to Figure 8 is shown. This line graph contains records from the database that are between the two dates specified on the user interface.
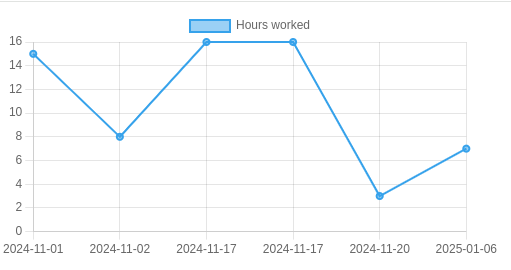
Figure 8: Line graph showing total hours worked by day between a specific date range.
Figure 9 shows the output when the total hours by month button is clicked. Here, a new tab is opened containing the bar chart. This chart contains all the records logged in the database, ordered by month.
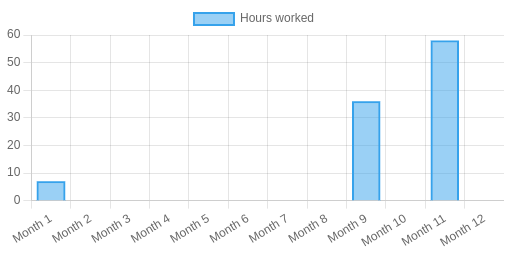
Figure 9: Bar graph showing the total hours worked by month.
Summary
This chapter outlined the process of creating an extension to log individual hours worked to a database. To aid the layout of the user interface, a jQueryUI accordion was used, allowing the user to hide and show different sections of the extension. Using this data, two different graph types were generated using the Chart.js chart visualization library.
Take-away Tips:
-
When working with dates, use a standard format such as ISO format to allow for easy manipulation and extraction where required.
-
The HTML <select> tags contain a value attribute that is associated with the option shown to the user. To aid data exchange, a simple format such as 1-24 can be used to represent times instead of appending a.m. and p.m. to the strings.
-
The find() MongoDB function allows a date range to be passed in using the $gt and $lt syntax, which are each followed by ISO formatted dates.
-
Charts.js provides a simple method for creating both line and bar charts. This requires a HTML page with a <canvas> tag to contain the chart.
-
When calling API server URLs, variables can be passed as key-value pairs in the URL to the API server, such as type=line with ampersands between pairs: type=line&startDate=1-11-2025.
-
When variables need to be extracted from a URL, the window.location.search JavaScript function contains the raw URL for a given page. This can be passed into a new URLSearchParams object to make the variables more accessible.
-
To drop a variable value into an API server URL call, the ${} syntax can be used, e.g., ${startTime}.
-
Additional libraries, such as jQueryUI, can be used to add layouts to the user interface, such as an accordion layout to make the best use of available space.